Tuesday, June 15, 2010


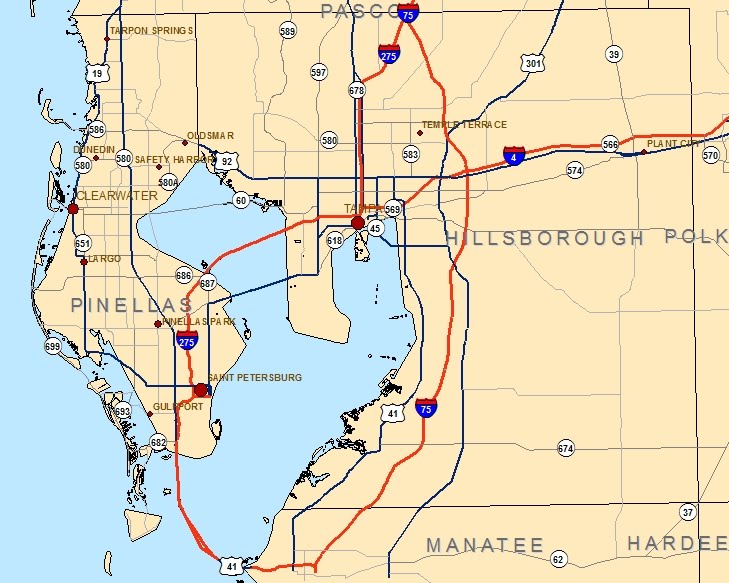
This map shows the sectors that are dominated by Agriculture Forestry and Fishing. This was another map that was great to work through and learn the techniques used. I should be able to use these same techniques at work on a daily basis! This aspect of GIS is being used quite a bit right now with the situation in the Gulf of Mexico. Folks are losing their livelyhoods and GIS analysts are tasked with among many other things, documenting the severty of this loss.

Tuesday, June 1, 2010

Mississippi Coast Topology and Hydrology


This map shows the elevation of the Mississippi coast in different colors with a scale bar in the legend. It shows cities / towns and rivers which are displayed with light blue lines. The pink areas on the map display the wetland areas that were affected by storm surge during Hurricane Katrina.

Hurricane Katrina Storm Surge


This map shows the southern portion of Mississippi along the Gulf of Mexico. The map indicates areas that were inundated by Katrina's storm surge, a flooding tide associated with tropical cyclones. These areas are broken into catergories and have a corresponding percentage value in the bar graph inset.

Tuesday, April 27, 2010

Final Project

http://students.uwf.edu/krm20/presentation.htm

http://students.uwf.edu/krm20/bobwhite.htm

Please copy and paste the links to my final presentation and summary.

Kyle McWhorter 4/27/2010

Saturday, April 10, 2010

Week 11 ESRI

final_CitiesAndRoads from "Manage your labels with class"


final_Recreation from "Add custom text to your maps"


Model from "Work with Spatial Analyst tools"


ReclassVeg2 from "Reclassify data to common scale"


3D Analyst

This map shows a 3D TIN (trianulated irregular network) with a shapefile of a hike overlayed on top. Under the TIN is a raster in 2D.

Tuesday, March 30, 2010

Week10 Gulf County Property Owners


This map shows the 4 largest property owners in Gulf County, FL. I chose not to label the cities and streets because I felt that it might distract from the focus of the map which is total land area owned.

Sunday, March 21, 2010

Week 9


Q1. I used the intersect tool to use the common features in each class. There were no noticable differences.

Q2. I used the erase tool to erase the potential sites that fell within the conservation areas.

Q3. There were 79 features in this layer. The largest was 7,765,304 square meters. The smallest area was 748 square meters.

Monday, March 1, 2010

Week 7


This map is an extension of last weeks map with added and edited shapefiles.

Tuesday, February 9, 2010

Haiti Map


This image shows elevation, waterways, roads and major cities among other things.
I found this map on the Army Geospatial Center's website.
This is a general purpose map.

Monday, February 8, 2010

Week 4 lab


This map shows three different projections of Florida.

Sunday, January 31, 2010

Saturday, January 9, 2010

Hello

I am looking forward to learning!!