Tuesday, June 15, 2010


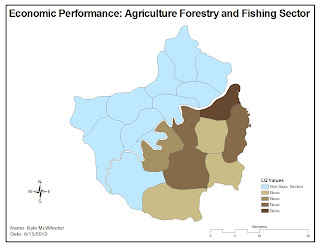
This map shows the sectors that are dominated by Agriculture Forestry and Fishing. This was another map that was great to work through and learn the techniques used. I should be able to use these same techniques at work on a daily basis! This aspect of GIS is being used quite a bit right now with the situation in the Gulf of Mexico. Folks are losing their livelyhoods and GIS analysts are tasked with among many other things, documenting the severty of this loss.

Tuesday, June 1, 2010

Mississippi Coast Topology and Hydrology


This map shows the elevation of the Mississippi coast in different colors with a scale bar in the legend. It shows cities / towns and rivers which are displayed with light blue lines. The pink areas on the map display the wetland areas that were affected by storm surge during Hurricane Katrina.

Hurricane Katrina Storm Surge


This map shows the southern portion of Mississippi along the Gulf of Mexico. The map indicates areas that were inundated by Katrina's storm surge, a flooding tide associated with tropical cyclones. These areas are broken into catergories and have a corresponding percentage value in the bar graph inset.